GCSE Physics · Thermal practical
Specific Heat Capacity Virtual Practical
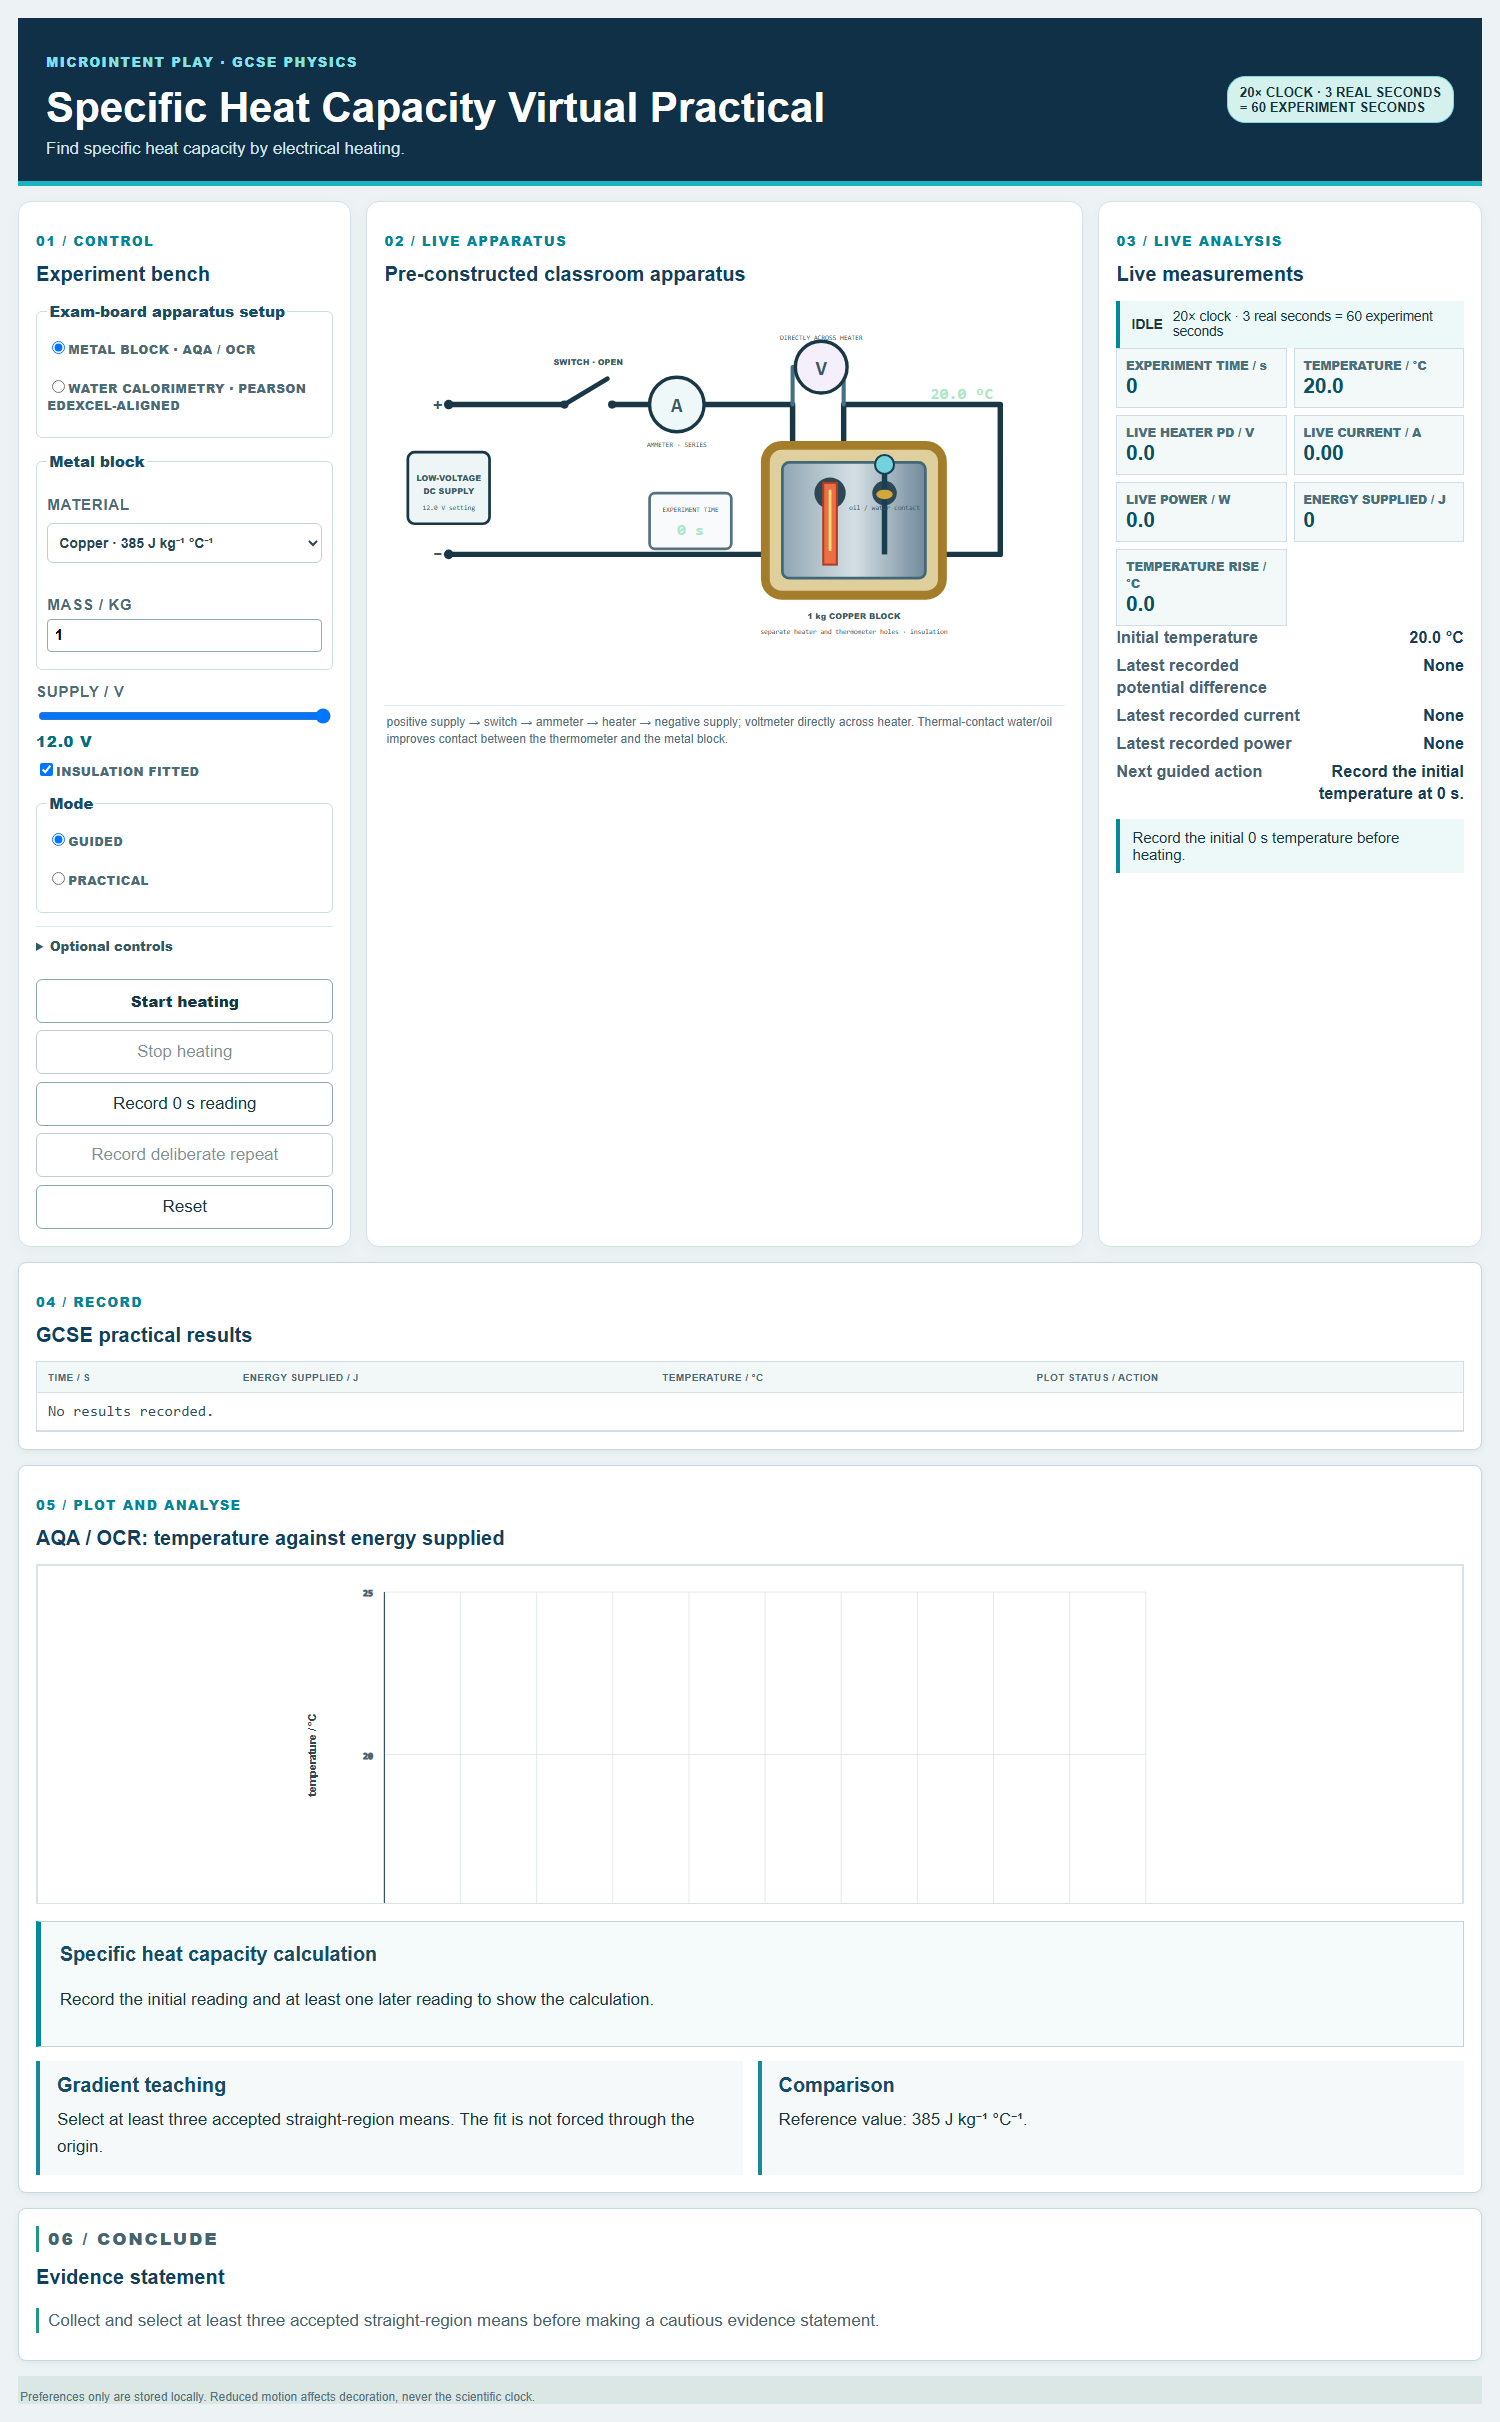
Heat a metal block or water calorimeter with a low-voltage heater, record energy and temperature, and determine specific heat capacity from a graph.
What you will investigate
This practical determines the specific heat capacity of a material by transferring a measured amount of electrical energy to it and recording the resulting temperature change.
The dashboard supports two classroom arrangements. The metal-block method plots temperature against energy and uses the reciprocal gradient. The water-calorimetry method plots energy against mass × temperature change and uses the gradient directly.
The two arrangements do not use the same graph convention. The dashboard keeps the calculation for each method separate so that the gradient is interpreted correctly.
Learning objectives
- Calculate electrical power and energy using P = V I and E = V I t.
- Measure mass and temperature change accurately.
- Plot the appropriate graph for the chosen method.
- Determine specific heat capacity from the gradient.
- Compare the experimental value with a reference value.
- Evaluate heat loss, insulation and thermal contact.
Before you start
Apparatus
- Low-voltage DC supply, heater, ammeter and voltmeter
- Metal block with heater and thermometer holes, or insulated water calorimeter
- Thermometer or temperature probe
- Balance for measuring mass
- Insulation, stirrer and heatproof surface
Safety
- Use a low-voltage supply and switch off before adjusting the apparatus.
- Heater, block and water can become hot; use a heatproof surface.
- Keep water away from electrical connections and wear eye protection.
- Allow the apparatus to cool before dismantling it.
Method
Choose the arrangement
Select the metal block or water calorimeter. Check that the heater and thermometer are in good thermal contact with the sample.
Measure the mass
Record the mass of the metal block or the mass of water in the calorimeter. Use the same balance and unit throughout.
Record the initial temperature
Read the temperature once the apparatus has settled. For water, stir gently before reading.
Set the electrical supply
Record the potential difference and current. Calculate the power using P = V I.
Heat and record temperature
Start the timer and record the temperature at regular intervals. For water, stir before each reading.
Calculate the energy transferred
Use E = P t = V I t for each time interval. Record the energy and the corresponding temperature.
Plot the appropriate graph
For the metal block, plot temperature against energy. For water, plot energy against mass × temperature change.
Calculate specific heat capacity
Use the gradient and the mass to determine c. Compare the result with a reference value and evaluate the uncertainty.
The physics
Specific heat capacity is the energy needed to raise the temperature of 1 kg of a substance by 1 °C. It is a property of the material, not the size of the sample.
In the metal-block method, the graph of temperature against energy has gradient ΔT / ΔE = 1 / (m c), so c = 1 / (m × gradient).
In the water-calorimetry method, the graph of energy against m ΔT has gradient c directly. Using the metal-block formula for water would give the wrong answer.
Heat loss to the surroundings, the heat capacity of the container and imperfect thermal contact all tend to make the experimental value differ from the reference value.
P = V IElectrical power transferred by the heater.E = P t = V I tElectrical energy transferred over a measured time.ΔE = m c ΔTEnergy needed to change the temperature of a mass by ΔT.c = ΔE / (m ΔT)Specific heat capacity in J kg⁻¹ °C⁻¹.c = 1 / (m × gradient)Metal-block method, where the graph gradient is ΔT / ΔE.c = gradientWater-calorimetry method, where the graph gradient is ΔE / Δ(mΔT).Using the virtual practical
Guided mode
Guided mode pauses at exact experiment times and calculates the expected readings. It makes the graph convention and the gradient calculation explicit.
Practical mode
Practical mode asks learners to record readings and manage the timing and stirring themselves, including repeats and excluded readings.
What the dashboard records
- Arrangement, sample material and mass
- Potential difference, current and power
- Time, temperature and temperature change
- Electrical energy and accepted means
- Graph, gradient and specific heat capacity calculation
Results and analysis
Relationship
The temperature change is proportional to the energy transferred, provided the mass and material stay the same and heat loss is small.
Graph
Metal block: temperature on the y-axis, energy on the x-axis, gradient ΔT / ΔE. Water: energy on the y-axis, m ΔT on the x-axis, gradient c.
Conclusion
State the experimental specific heat capacity with units, compare it with a reference value, and explain the main sources of difference.
Common misconceptions
- Specific heat capacity is the total heat energy in an object.
- Specific heat capacity is the energy needed per kilogram per degree Celsius. It is a material property.
- A larger temperature change always means more energy was transferred.
- Energy also depends on mass and specific heat capacity: ΔE = m c ΔT.
- The metal-block and water graphs use the same gradient formula.
- The axes are different. The metal block uses the reciprocal gradient; the water method uses the gradient directly.
- All the electrical energy reaches the sample.
- Some energy is lost to the surroundings and the container. Insulation and good thermal contact reduce the loss.
Teacher notes
The metal-block and water-calorimetry methods use different graph conventions. The dashboard labels each calculation separately to prevent the reciprocal-gradient error.
Interactive dashboard
Run the practical
Guided mode pauses at exact experiment times and calculates the expected readings. It makes the graph convention and the gradient calculation explicit.
- Runs locally in the browser
- Keyboard, mouse and touch support
- Reduced-motion preference respected
- No account or personal data required