GCSE Physics · Required practical
Density Virtual Practical
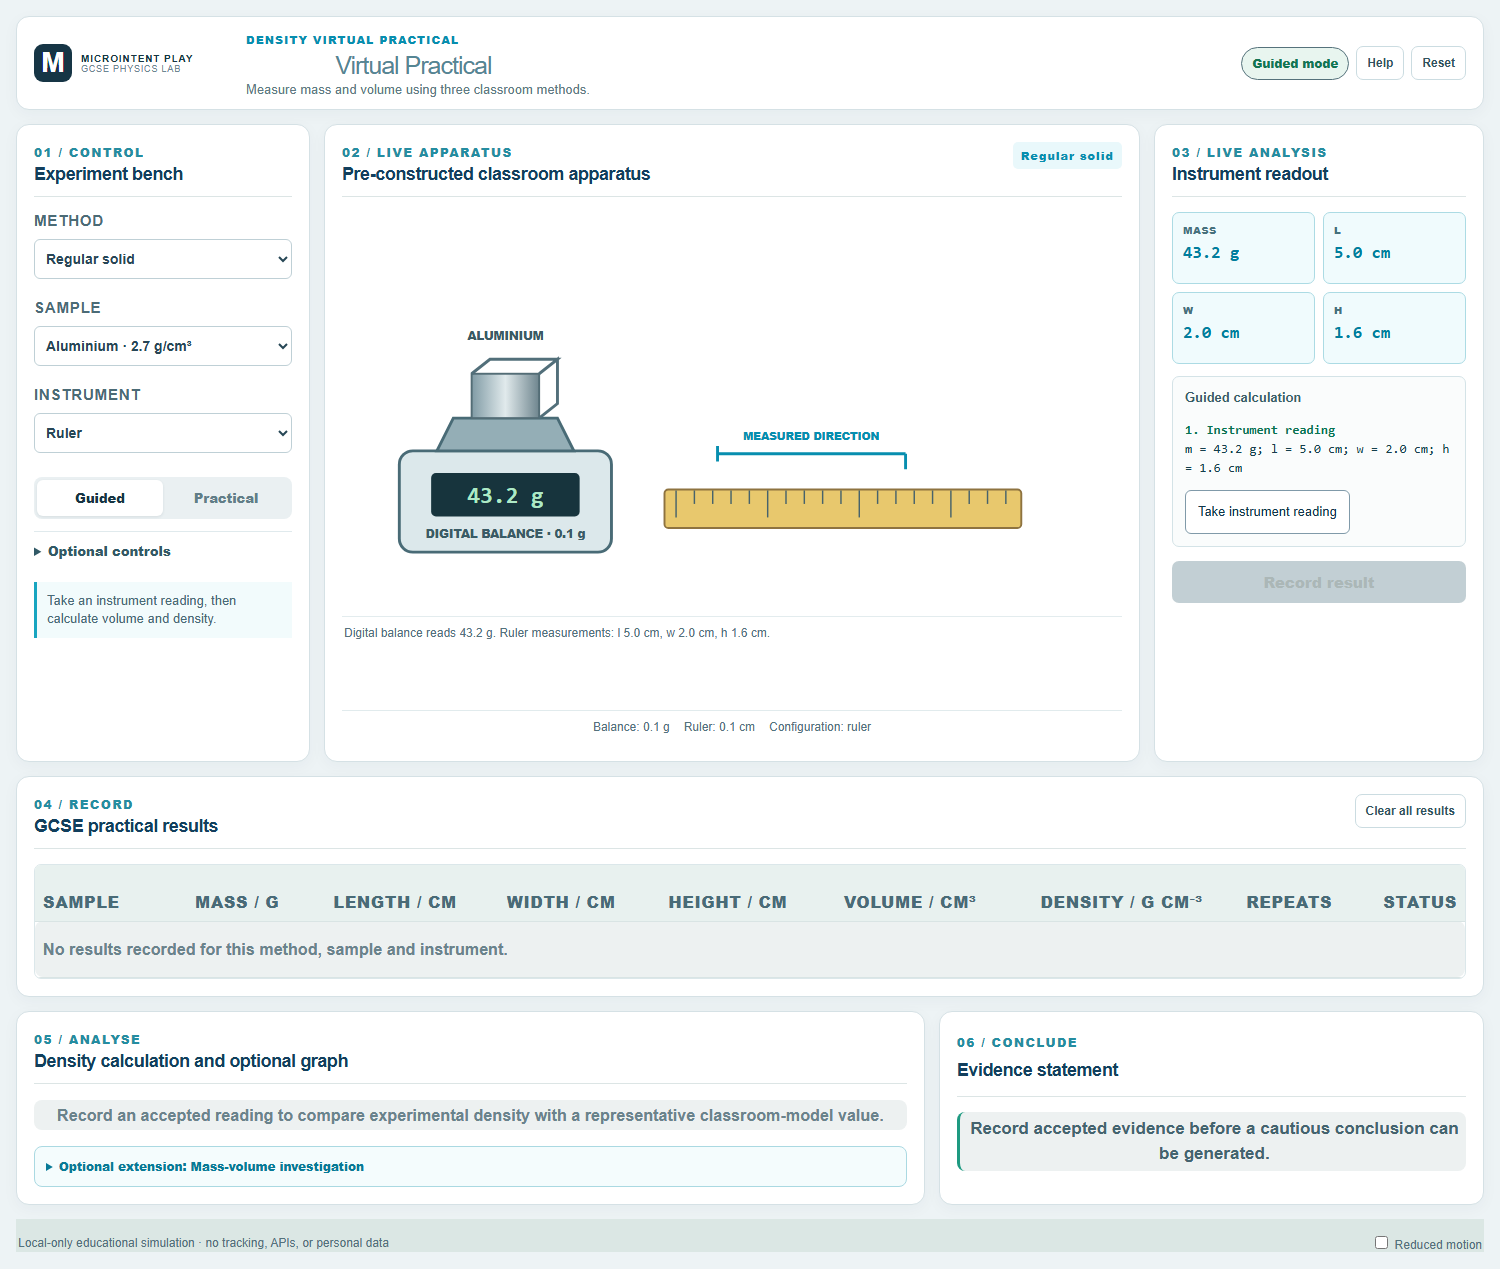
Measure mass and volume using a regular solid, displacement and mass difference, then calculate density from your own results.
What you will investigate
This practical determines the density of a material by measuring its mass and volume. Three classroom methods are available: a regular solid measured with a ruler, an irregular solid measured by displacement, and a liquid measured by mass difference.
Density is a property of the material. A larger sample has a larger mass and a larger volume, but the ratio m / V stays approximately constant for the same material.
The optional mass–volume investigation plots mass against volume. The gradient of that graph is the density.
Learning objectives
- Measure mass with a digital balance.
- Measure volume using dimensions, displacement or mass difference.
- Calculate density using ρ = m / V.
- Convert between g/cm³ and kg/m³.
- Plot mass against volume and interpret the gradient.
- Evaluate repeats, anomalies and percentage difference.
Before you start
Apparatus
- Digital balance
- Ruler or vernier callipers for a regular solid
- Measuring cylinder and displacement can for an irregular solid
- Beaker, water and a container for the liquid method
- Samples of known and unknown materials
Safety
- Clean up water spills immediately to avoid slips.
- Handle glassware and masses carefully.
- Wear eye protection when using water near electrical equipment.
- Read the meniscus at eye level to avoid parallax error.
Method
Choose the method
Use the regular-solid method for a shaped sample, displacement for an irregular solid, or mass difference for a liquid.
Measure the mass
Place the sample on the balance and record the mass. For the liquid method, record the empty and filled masses.
Measure the volume
For a regular solid, measure its dimensions and calculate the volume. For displacement, record the initial and final water levels.
Calculate density
Use ρ = m / V. Keep the units consistent and convert to kg/m³ if required.
Repeat and check
Take repeat readings where possible and look for anomalies. Calculate a mean for accepted results.
Plot mass against volume
For the extension, plot mass on the y-axis and volume on the x-axis. The gradient is the density.
Evaluate
Compare the mean density with a reference value and calculate the percentage difference. Explain the main sources of uncertainty.
The physics
Density is a material property: for the same material and conditions, the ratio of mass to volume is approximately constant.
The displacement method works because the irregular solid displaces its own volume of water. The rise in the water level is the volume of the solid.
The mass-difference method measures the mass of a known volume of liquid. The volume is read from the container, so the meniscus must be read at eye level.
On a mass–volume graph, the gradient is density. A steeper gradient means a denser material.
ρ = m / VDensity equals mass divided by volume.V = l × w × hVolume of a rectangular regular solid.V = π r² hVolume of a cylindrical regular solid.Vdisplaced = Vfinal − VinitialVolume of an irregular solid by displacement.mliquid = mfilled − memptyMass of a liquid by mass difference.1 g/cm³ = 1000 kg/m³Conversion between common density units.Using the virtual practical
Guided mode
Guided mode checks the mass or volume step and shows the density calculation before you record the result.
Practical mode
Practical mode asks you to read the balance, ruler or cylinder and record the values yourself, including repeats and anomalies.
What the dashboard records
- Method, sample and dimensions
- Mass, initial and final volume readings
- Calculated density and accepted mean
- Repeats, anomalies and percentage difference
- Optional mass–volume graph and gradient
Results and analysis
Relationship
For samples of the same material, mass should increase in proportion to volume, so the mass–volume graph should be a straight line through the origin.
Graph
Plot mass on the y-axis and volume on the x-axis. The gradient is the density. The intercept should be close to zero for a correctly zeroed balance and volume measurement.
Conclusion
State the mean density with units, compare it with a reference value, and explain whether the evidence supports the identification of the material.
Common misconceptions
- Density is the same as weight.
- Density is mass per unit volume. Weight is a force and depends on the gravitational field strength.
- Volume and mass are the same quantity.
- Mass measures the amount of matter; volume measures the space it occupies. Density relates the two.
- The displaced volume is the final cylinder reading.
- The displaced volume is the difference between the final and initial readings.
- A larger sample has a larger density.
- For the same material, a larger sample has more mass and more volume, but the density stays approximately constant.
Teacher notes
The three methods are deliberately kept separate so that learners can compare the measurement decisions involved in each one.
Interactive dashboard
Run the practical
Guided mode checks the mass or volume step and shows the density calculation before you record the result.
- Runs locally in the browser
- Keyboard, mouse and touch support
- Reduced-motion preference respected
- No account or personal data required